Also available in: Español (Spanish) Euskara (Basque)
Translation of the unrolled copy of my astrothread from 05/31/2024 on Twitter/X
How many galaxies are there? How many do we detect in an integrated image of a few hours? What brightness, distance, mass will they have? How many stars will be being born in them? This technical article (in press) tells you about it https://arxiv.org/abs/2403.15650 and the explanation for the general public below.
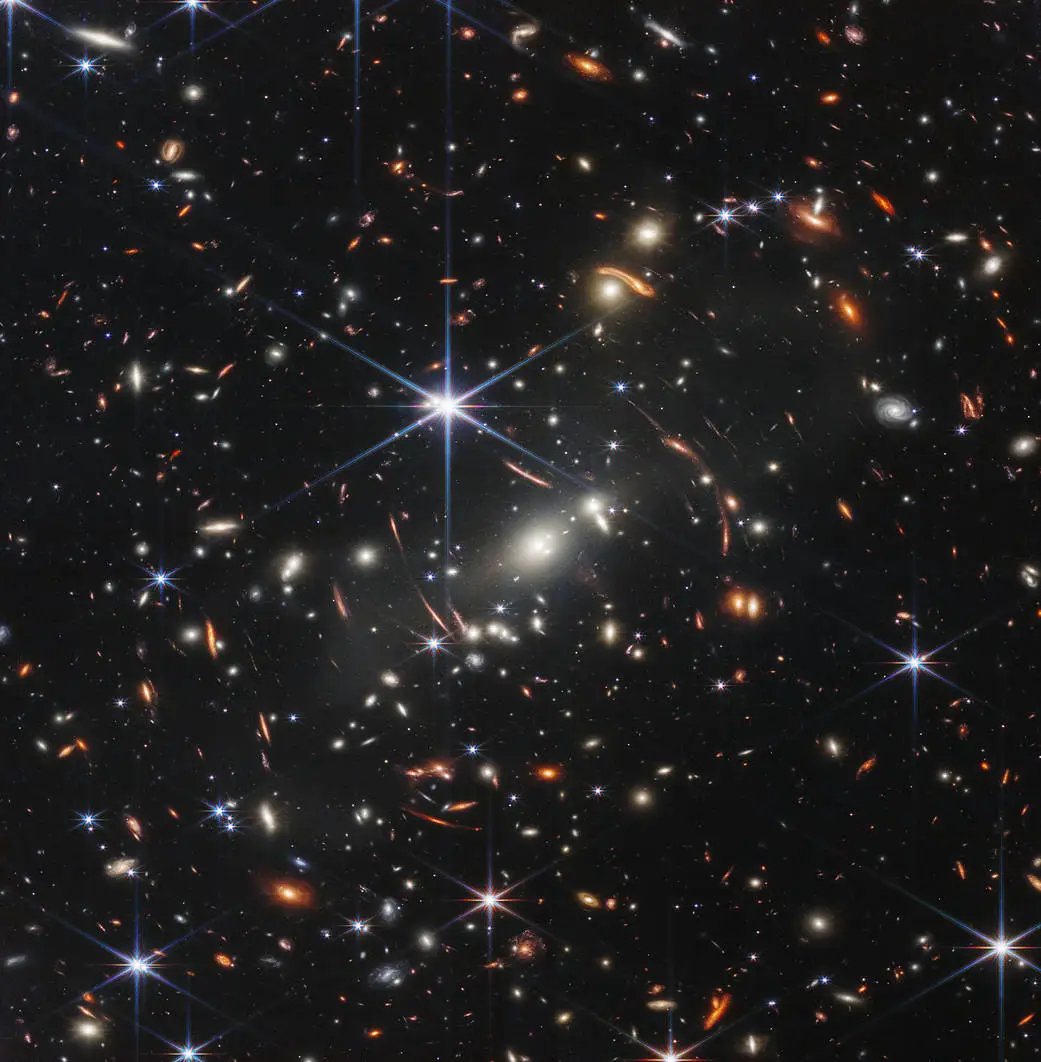
NIRCam image from the James Webb Space Telescope of the cluster SMACS 0723, in which thousands of galaxies can be seen. Image credits: STScI / NASA
In a computer we can predict how the mass of galaxies changes over time, from very early times to the present day. We use the Bolshoi-Planck simulation of dark matter to predict which galaxies we will find in 5.3 square degrees of the sky.
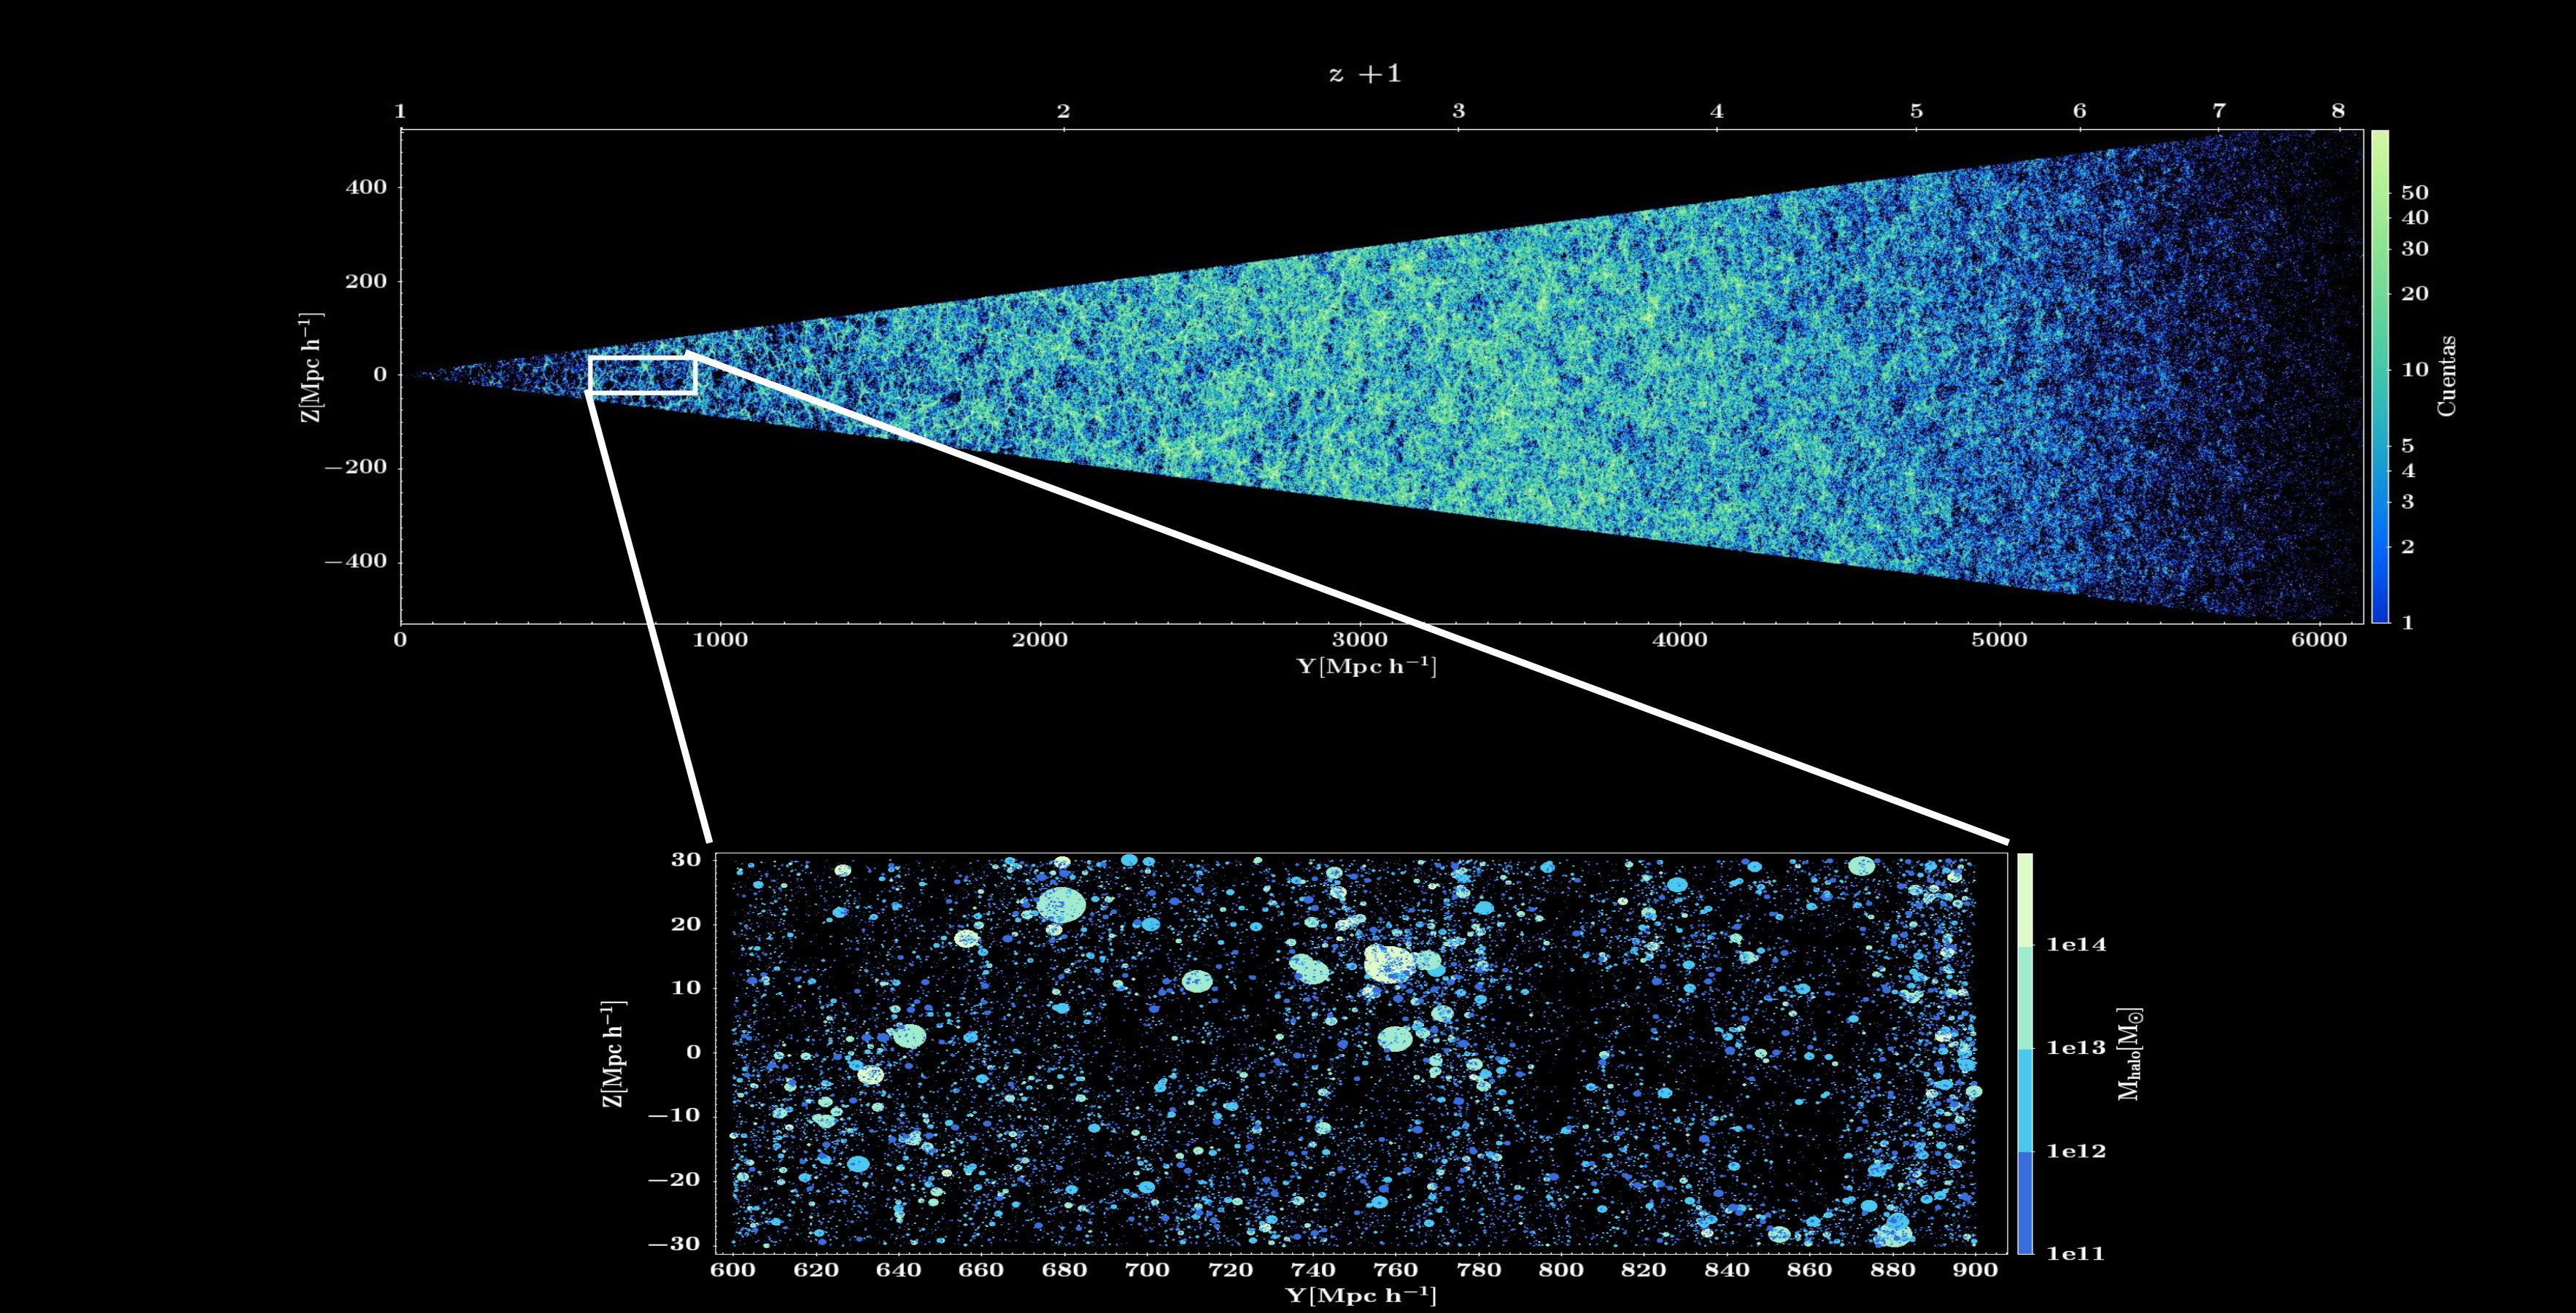
Representation of the portion of the visible Universe in 5.3 square degrees (about 26 full moons, at the base of the triangle perpendicular to the plane represented). In the image you can see a triangle that represents the density of dark matter haloes at different distances. It reaches redshift 8, about 30,000 million light years away, in such a way that the light from the galaxies that inhabit the haloes at greater distances has traveled 95% of the life of the Universe to reach an observer who simulates to the Milky Way today (at the apex of the triangle). In a lower section a small portion of the pyramid is represented, with the halos marked by circles of radius proportional to their mass. Credits: Araceli Nava Moreno
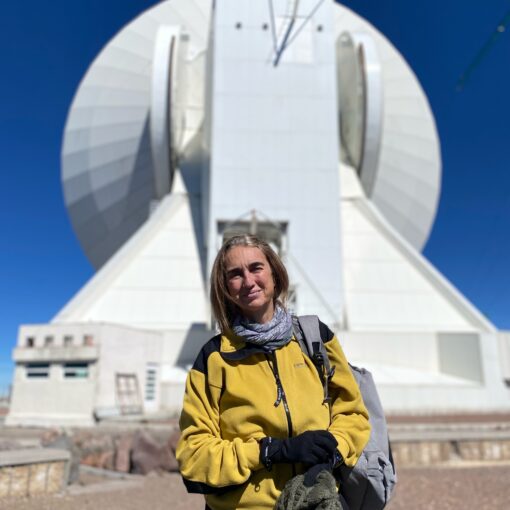
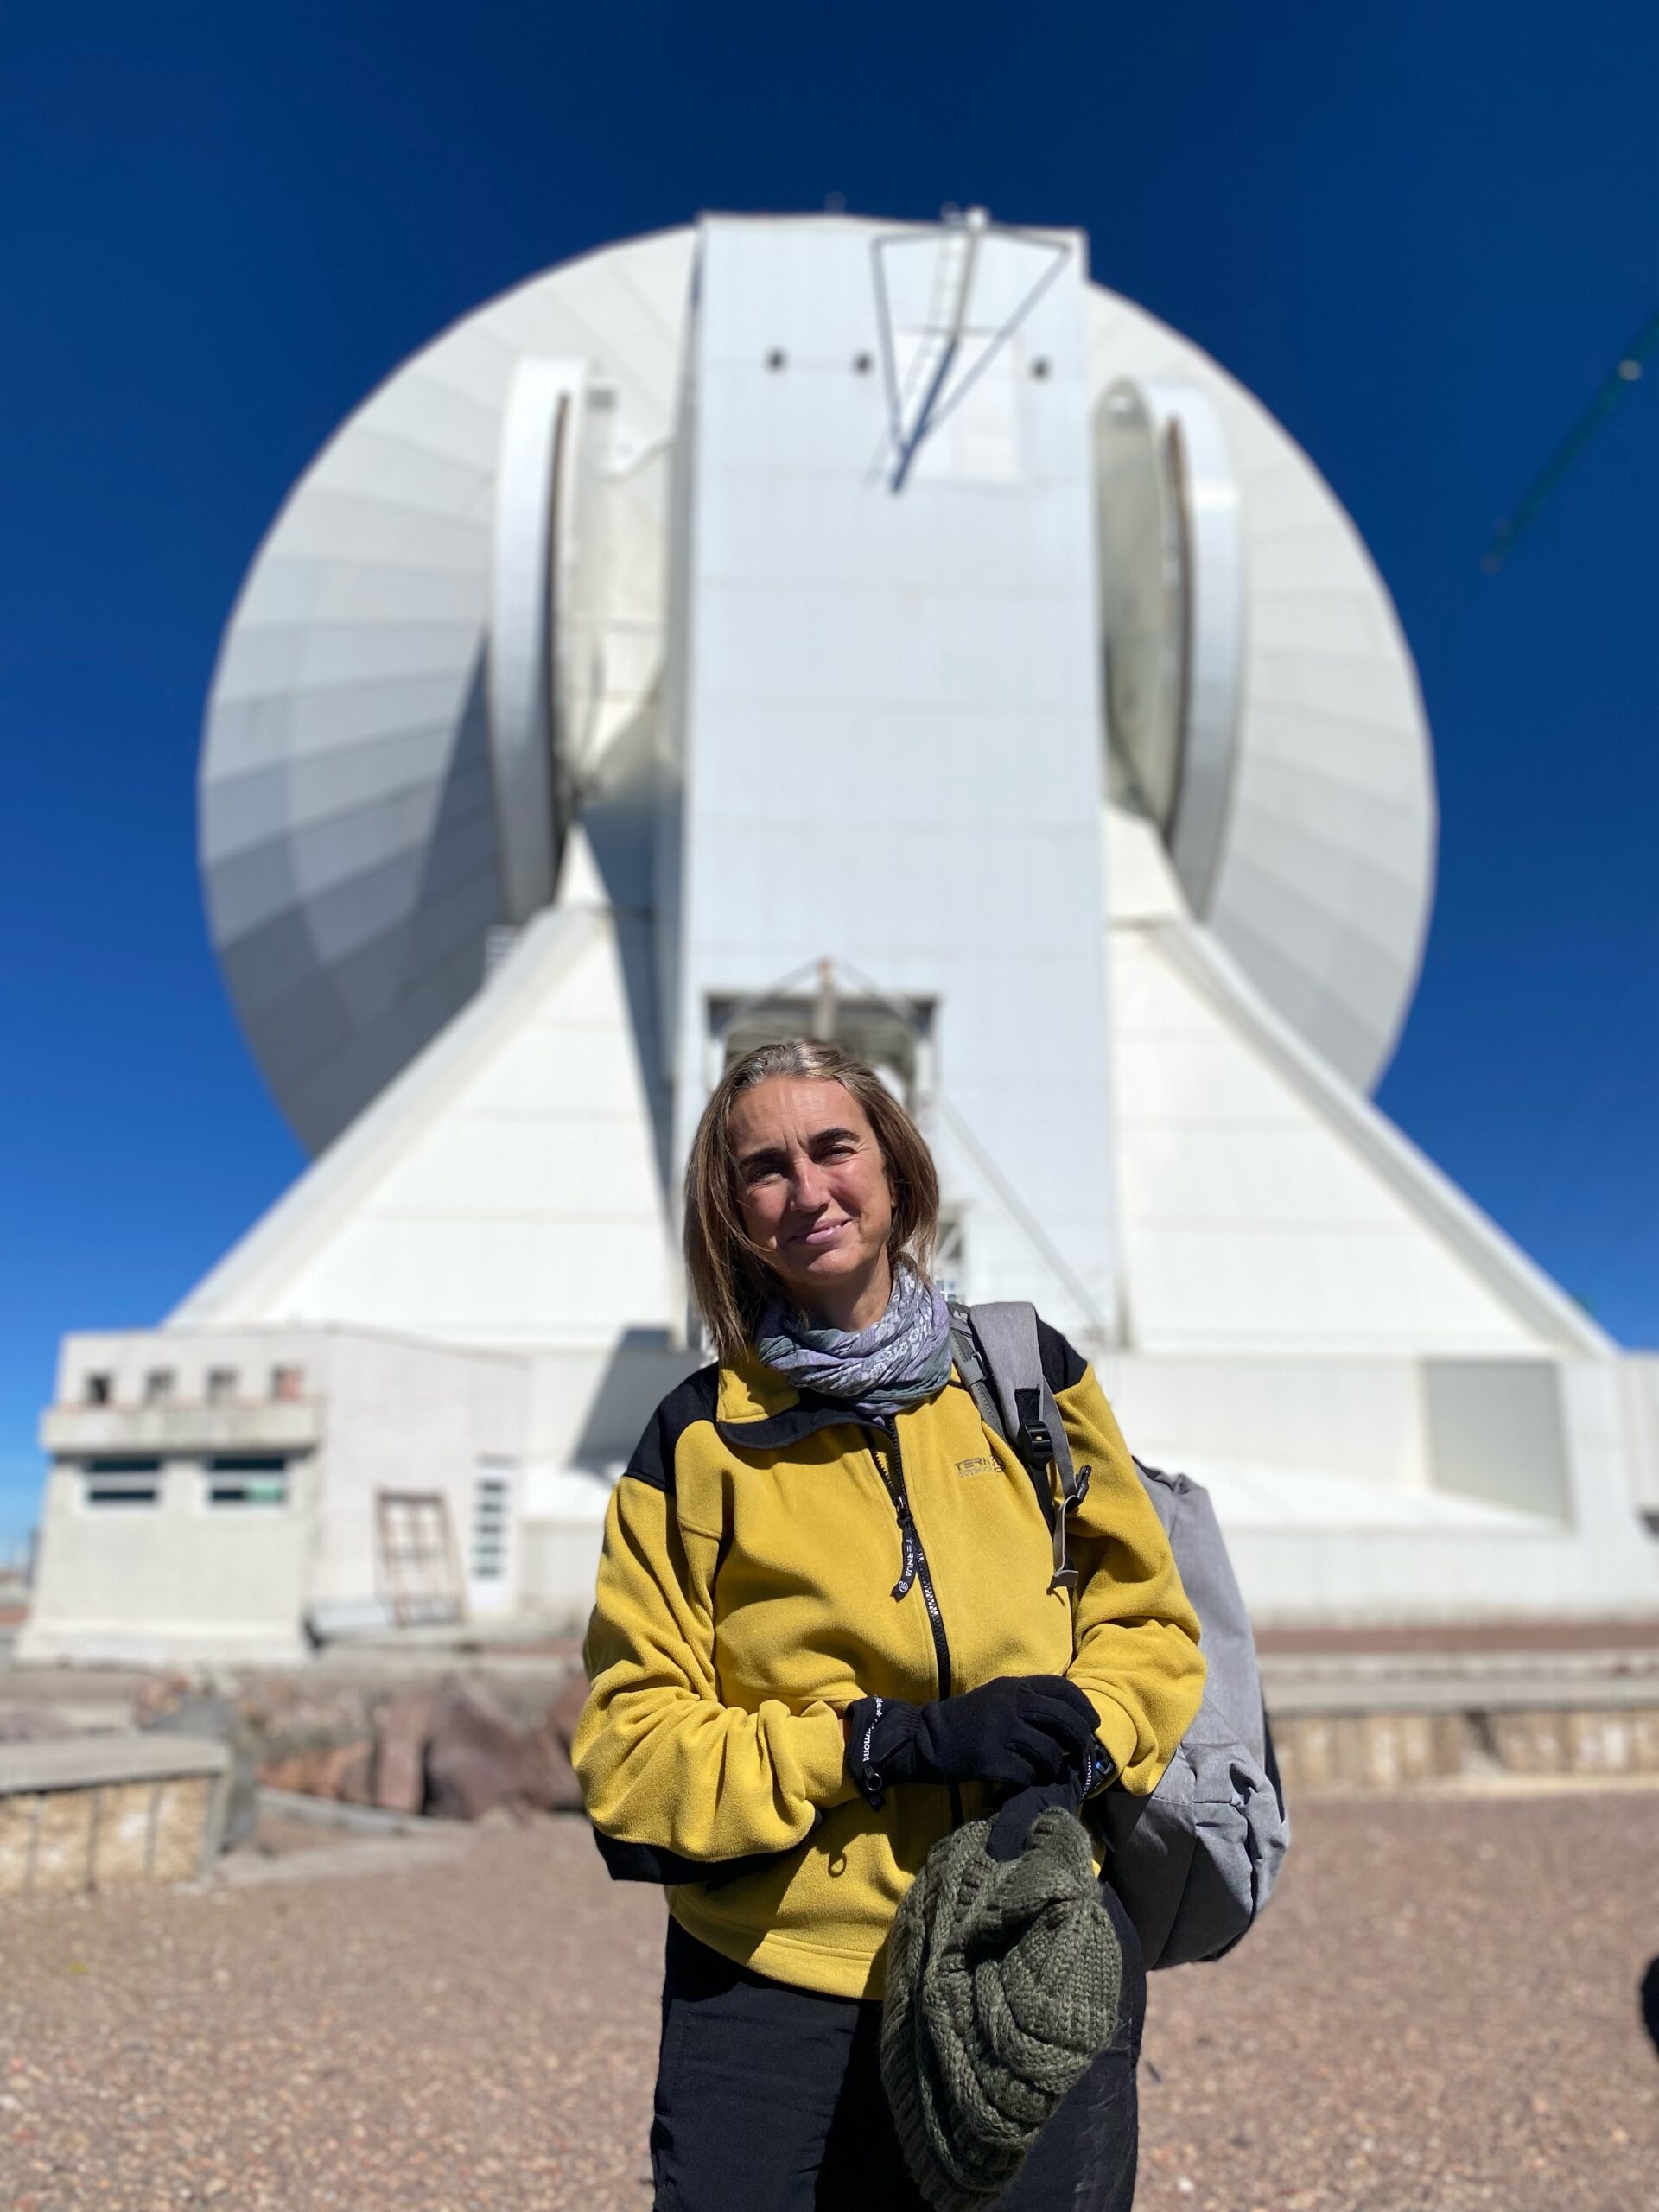
We can associate the total mass of galaxies with their mass in stars, their rate of star formation, their dimming and emission in millimeter waves to predict which ones we could detect with telescopes such as the Alfonso Serrano Large Millimeter Telescope in Puebla, and its new imaging camera, TolTEC.

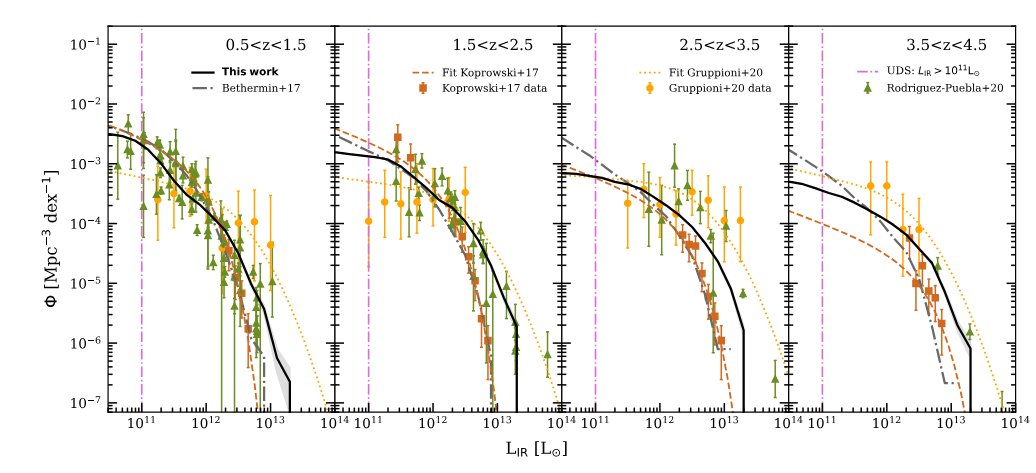
The properties of the simulated brightest galaxies very well reproduce the distributions of brightness, distance and rates of new star formation measured so far in sky surveys carried out with other millimeter telescopes.
For the deeper observations we will make with TolTEC at wavelengths of 1.1, 1.4 and 2.0mm, we predict that the deepest field of 0.8 square degrees (4 full moons) will have about 28,000 galaxies detectable up to distances of 30 billion light years.

Simulation of an observation of the sky seen by TolTEC at 1.1mm in an area of 0.3 square degrees, corresponding to an area equivalent to one and a half moons. Atmospheric and instrumental effects are considered in this simulation. The bright spots correspond to galaxies from the Nava-Moreno and collaborators catalog that could be detected with TolTEC. Credit: master’s thesis by Daniela Espitia, INAOE 2023.
The simulation allows us to deduce that there will be galaxies that appear on top of each other in the image and how to correct this effect that makes us overestimate their brightness. Sometimes we can attribute 90% of the detected brightness to one galaxy, when there are actually many of them together.

The article is headed by INAOE student Araceli Nava Moreno. It is also signed by E. Peralta, INAOE student, A. Montaña, A. Rodríguez-Puebla, V. Ávila-Reese and myself, researchers from INAOE and IA-UNAM.